
Lesson 1 of 6. You are building the bench from nothing. The answer is on branch
step-1-deviceif you want to check it — or start there and read.
Every instrument in PLESTY is wrapped by a device module: a Python package that knows the instrument's own protocol — its cables, its command language — and hides all of it behind ordinary Python methods.
That module is then run as a device server: a program that holds the instrument open and waits on a network port. Anything that wants a reading connects to that port and asks. This sounds like overkill on one PC, and on one PC it is; in a real lab the spectrometer is plugged into a Windows machine in the corner and the analysis runs somewhere else, so the network is there from the start rather than bolted on later.
A program that connects to a server and calls its operations is a client.
Start with one instrument: a Thorlabs PM100D, which measures how much light is falling on a sensor.
Find the module
No need to write the module. Check hub.plesty.net to find available modules that may match your needs. The hub lists every module on the platform, searchable by name and filterable by category, vendor and compliance standard.
Searching it for pm100d gives the powermeter and the four things anyone needs before using it: what it is called, where it comes from, which release, and how far it is held to the standard. Follow its docs link too — every module publishes documentation at docs.plesty.net, generated from the code so it cannot drift from what the server accepts. Functions lists the operations with their arguments, Parameters the settings with their units and limits, and Usage shows how to call them.
If nothing on the hub matches your instrument, that is when you write a module — Build a Device is that path.
Plesty Serving Platform
A module is a Python package; it does not run itself. plesty-server is the program that turns one into a running instrument — it installs modules, launches their servers, supervises them, and keeps the logs and the job history. It is the bench's own console, and it has a window.
Install it
macOS and Linux — one line:
curl -LsSf https://gitlab.com/api/v4/projects/85550357/packages/generic/plesty-server/v0.2.6/install.sh | sh
Windows — download plesty-server-v0.2.6-windows-setup.exe from the v0.2.6 release and run it. It installs per user and asks for no administrator rights.
Both do the same three things: install uv if it is missing, install the bench, and add an entry to the Start menu or Launchpad so the console opens like any other application.
Each release publishes its own installer, and the one above pins 0.2.6 — the version this lesson was written against, so the window you see matches the pictures here. When you would rather have the newest, take the installer from the latest release instead, or upgrade afterwards:
uv tool upgrade plesty-server
That is also why uv is not in the prerequisites: if you do not have it, the installer gives it to you. If you already do, this is the whole installation:
uv tool install "plesty-server[gui]==0.2.6"
The one thing the installer cannot supply on macOS or Linux is git, which the bench needs to fetch a module from a repository — as this demo does. On Windows it downloads a portable copy for itself; elsewhere, install one if git --version says you have none.
Open it
plesty-server gui
or the PLESTY Bench entry the installer added.
Install a module from the catalogue
Catalogue ▸ Search & install… (Ctrl+K) is the hub again, inside the bench:
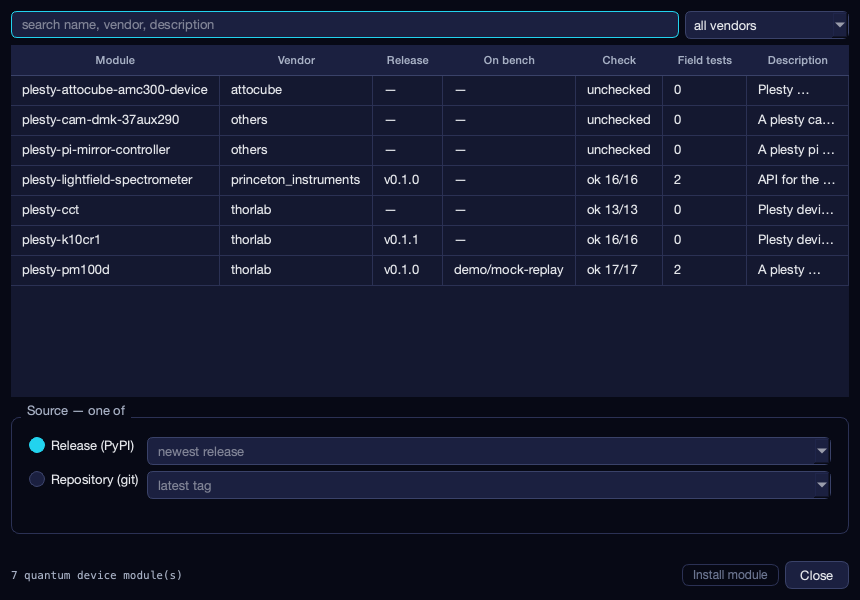
Search or filter by vendor, select plesty-pm100d, choose the source — a release from PyPI or a branch from the repository — and Install module. The On bench column shows what this bench already holds; here the three modules of this demo, installed from the demo/mock-replay branch.
Installing stocks the bench. It does not decide that you want to run one — a bench may hold a module and run two instances of it, on two ports, against two instruments. Making one is the next step.
Add a device
Making an instance is Edit ▸ Add device… (Ctrl+N):
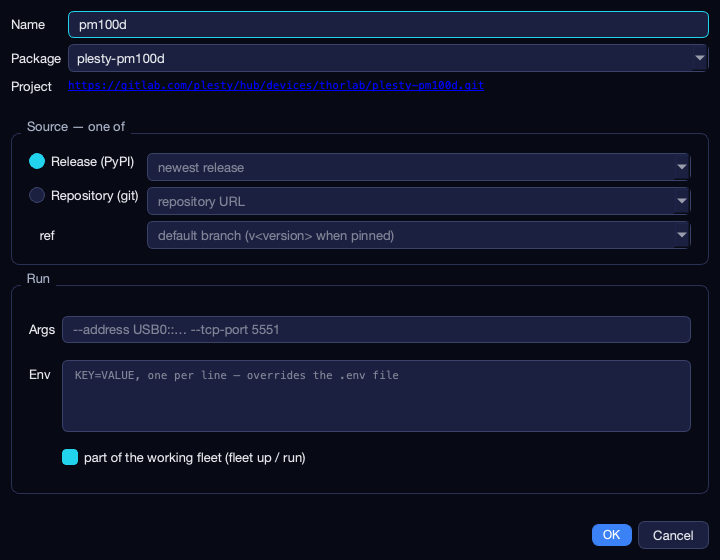
| Field | What it decides |
|---|---|
| Name | The instance name — it also names the virtual environment, the log file and the process record, so it is unique per bench |
| Package | Which installed module this is an instance of |
| Source | A PyPI release, or a git repository at a ref |
| Args | What the server is started with — how to reach the instrument, and anything the module takes |
| Env | Environment for this server only, on top of the bench's own |
For this lesson: name it pm100d, and the only argument it needs is --mock, which makes the module serve an in-memory simulator instead of reaching for a USB powermeter. That is why none of this needs hardware.
You do not choose a port. The bench allocates one — the lowest free port from 5551 up, skipping anything it already uses — and hands it to the server as --tcp-port when it starts, so what it probes and what the server binds cannot drift apart. Name a port in Args yourself and it takes yours instead.
(The check-box at the bottom decides whether the device starts with the rest of the bench. One device has no rest of the bench; it earns its meaning in the next lesson.)
Run it
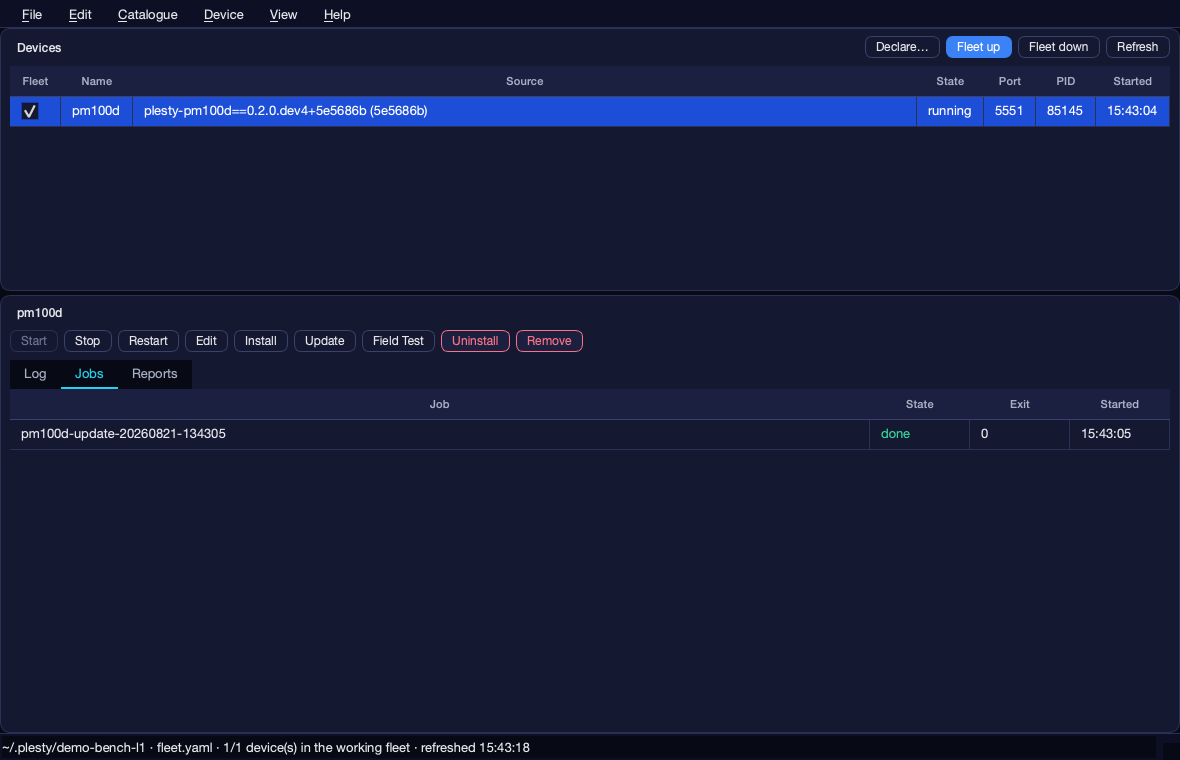
The top pane lists what this bench declares — one device, for now. Select the row and it highlights; everything below acts on it.
| Column | Meaning |
|---|---|
| Name | The instance name |
| Source | The package, and the version actually installed |
| State | running, stopped, exited |
| Port, PID, Started | Filled in while it runs |
Start (Ctrl+R) launches the server and waits until it answers — the state turns running, and the port and PID appear. Stop (Ctrl+T) shuts it down. Restart does both, which is what you want after changing a device's configuration.
The table refreshes itself every few seconds, so a server that dies shows up without you asking.
Edit the device config
Edit (Ctrl+E) reopens the same form, now with two tabs:
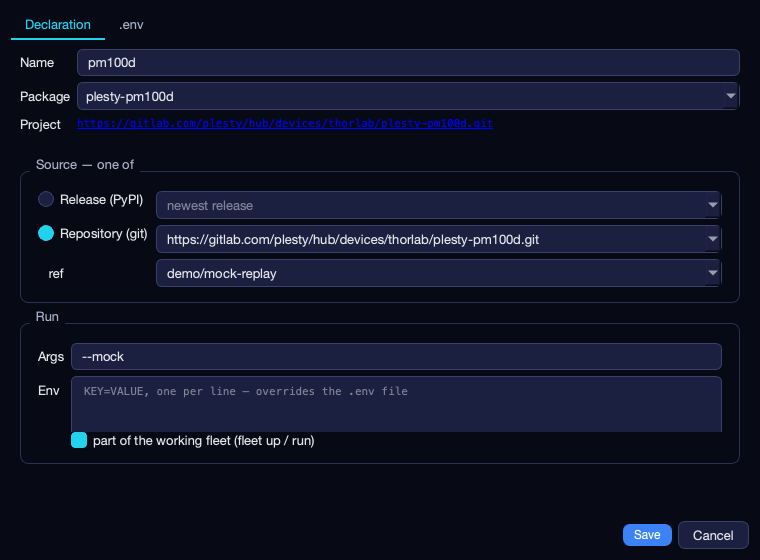
Declaration is the bench's durable record of this device — what the form above wrote down. .env is the environment file handed to its server process, where a real bench keeps an instrument's address, and where the next lesson puts real work.
What the other buttons do
Install, Update and Uninstall act on the device's virtual environment rather than its process: creating it, pulling and re-syncing it, removing it. Each runs as a job, because they are slow and can fail in ways worth reading afterwards.
Field Test (Ctrl+F) runs the module's own hardware test against the real instrument and publishes a report — the artifact behind a module's field-test count on the hub.
Remove drops the device from the bench's declarations without touching what is installed. The two red buttons are the destructive ones.
Logs and jobs
The three tabs under the buttons are where you look when something is wrong:
| Tab | Shows |
|---|---|
| Log | That device server's own output — what it said as it connected, what it has been asked to do, and any error it raised |
| Jobs | Installs, updates and field tests, with their state, exit code and start time; opening one shows its output |
| Reports | Field-test reports published for this device |
A device that will not start is almost always answered by the Log tab; an install that failed, by the Jobs tab. Anything the bench itself wanted to tell you appears in the strip under the buttons, and View ▸ Messages… keeps the whole session's worth — so a warning that scrolled past is not lost.
Everything the window did is also a command — plesty-server declare, install, start, status, log. The console and the command line are two faces of one bench and share the same records, so you can use either, in any order.
Start the project
The device is running, but you have nowhere to put your own code — the script that talks to it, and everything the next two lessons add. That is a project, and its layout is not hand-written either: plesty init scaffolds it, the same command every module on the platform starts from.
That command is not part of the bench. plesty comes from plesty-sdk, the development side of the platform, and installing plesty-server does not bring it — so install it once:
uv tool install plesty-sdk
Then scaffold the project:
mkdir plesty-demo-bench && cd plesty-demo-bench
uv run plesty init
If that second command reports Failed to spawn: plesty, the tool is installed but its directory is not on your PATH. uv tool update-shell adds it, and a new shell picks it up. It is also worth checking that plesty --help lists an init command: a plesty from some older install may be found first, and older ones called it build.
The name of the directory matters: plesty init takes the module name from it, dropping the plesty- prefix — so plesty-demo-bench gives you plesty/demo_bench/, which is what the later lessons import from.
There is no git init to do. The scaffold creates the repository itself and makes the first commit, so the pre-push hook it installs has somewhere to live.
That writes pyproject.toml (already depending on plesty-lib), a plesty/demo_bench/ package, tests/, docs/, the licence files and a GitLab CI configuration. Every lesson adds to that; none of it is rewritten.
The SDK is in the project's dev dependencies from here on, so inside the project it is simply part of the environment: uv run plesty check runs the compliance gates, with no --with needed, and the pre-push hook runs that same command. Fetching it by hand was only to bring the project into existence.
Talk to it as a client
The server is now the instrument, as far as the rest of the platform is concerned. Your own code goes in the package the scaffold made — plesty/demo_bench/, the same place every module on the platform keeps its code. Write plesty/demo_bench/read_power.py:
"""Read the powermeter through its device server."""

from plesty.lib.service import build_client

#: The address the bench gave the powermeter server — check it with
#: `plesty-server status`, or read it off the device table.
PM_ADDRESS = "tcp://localhost:5551"


def main() -> None:
    """Print the instrument's identity, its operations, and one reading."""
    with build_client(PM_ADDRESS) as pm:
        print("identity:", pm.identity())
        print("operations:", ", ".join(sorted(pm.describe()["methods"])))

        # An operation: something the instrument does.
        reading = pm.measure_power(averaging=10)
        print(f"power: {reading['power'] * 1e6:.3f} uW")

        # A parameter: something it holds. Correct for the excitation
        # wavelength, then read the setting back off the instrument.
        pm.write("wavelength", 780.0)
        print("wavelength:", pm.query("wavelength"), "nm")


if __name__ == "__main__":
    main()
Run it:
uv run python -m plesty.demo_bench.read_power
identity: THORLABS,PM100D,MOCK0001,1.0.0
operations: check_errors, check_operatability, clear, configure_and_measure_power,
  get_sensor_info, identity, measure_current, measure_power, query, reset,
  set_data_path, write, zero_and_measure_power, zero_sensor
power: 1.513 uW
wavelength: 780.0 nm
-m runs it as part of the package rather than as a loose file, which is how everything on the platform is started — you will meet the same form in lesson 4 as python -m plesty.demo_pol_pl. uv run installs the project's dependencies the first time, so there is nothing to activate: plesty-lib, where build_client lives, is already a dependency of the scaffold.
Now look at the other side
Four lines of output is what the client saw. Go back to the console, select pm100d, and open its Log tab:
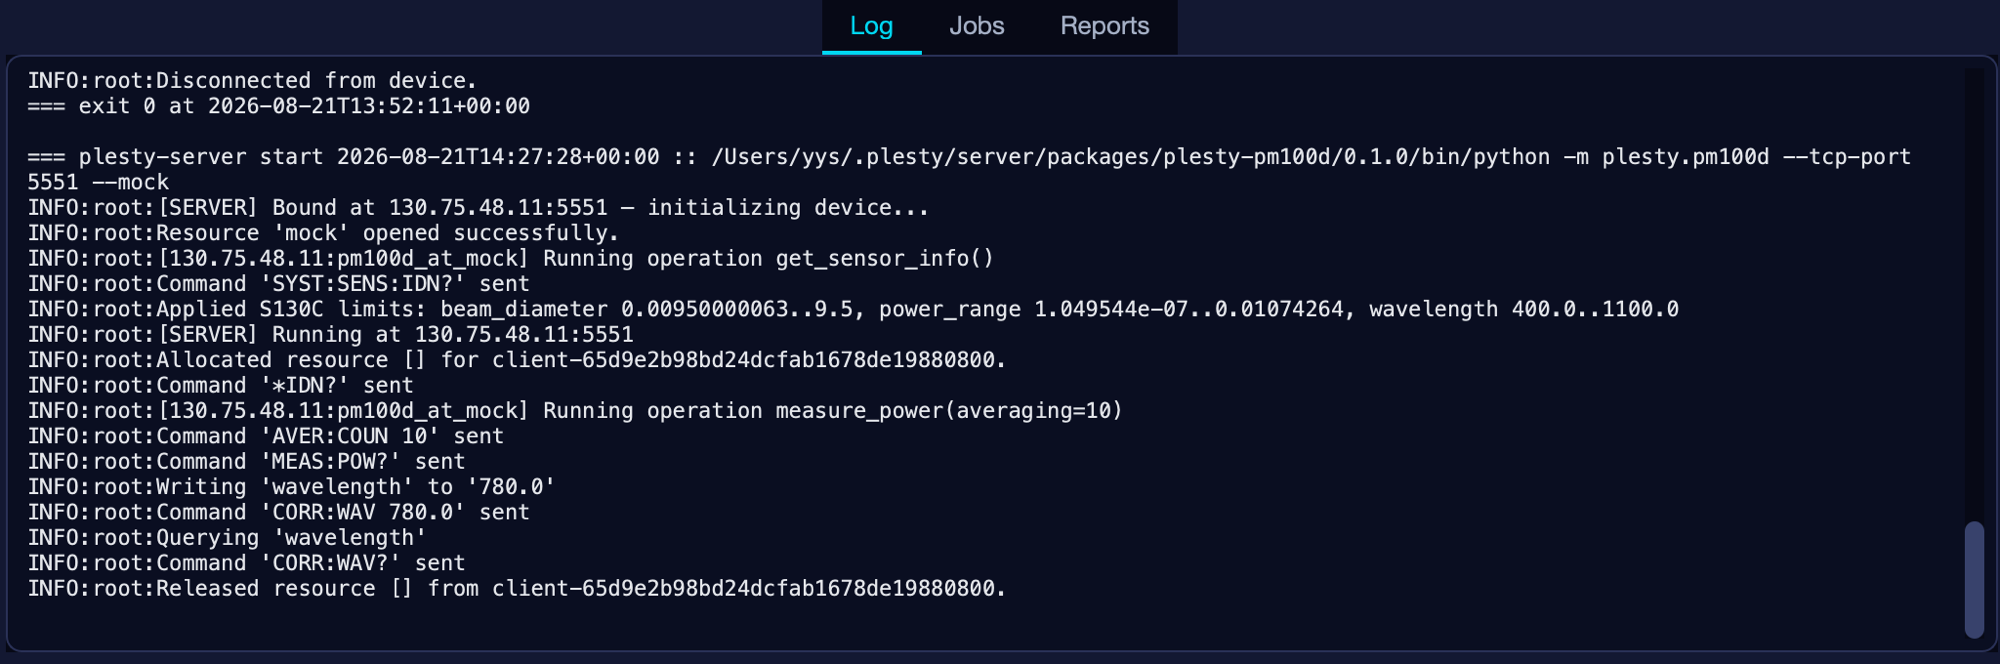
Read it against the script you just ran, line by line:
| In the log | What your script did |
|---|---|
Allocated resource [] for client-65d9e2… |
build_client(...) connected, and the server gave that client a hold on the instrument |
Command '*IDN?' sent |
pm.identity() |
Running operation measure_power(averaging=10) then 'AVER:COUN 10', 'MEAS:POW?' |
pm.measure_power(averaging=10) — one call became two instrument commands |
Writing 'wavelength' to '780.0' then 'CORR:WAV 780.0' |
pm.write("wavelength", 780.0) |
Querying 'wavelength' then 'CORR:WAV?' |
pm.query("wavelength") |
Released resource [] from client-65d9e2… |
leaving the with block |
This is the part worth pausing on. Your script said measure_power(averaging=10); the instrument was sent AVER:COUN 10 and MEAS:POW?. That translation is the entire job of a device module — the SCPI, the units, the order commands must come in — and it is what you no longer have to know at the client end. Swap the PM100D for a different powermeter and the log changes completely while the script does not.
Two other things the log tells you. The server holds the instrument for one client at a time — allocated on connect, released on exit — which is how two experiments do not talk over each other. And it kept running afterwards: the client came and went, the server did not.
What the four lines show
The reading. About 1.5 µW, and slightly different every time you ask: the simulator answers a baseline with noise on it. It has no opinion about physics — nothing is shining on anything. Making the mock answer with measured data is the next lesson.
The vocabulary is the server's, not the client's. Nothing about a PM100D is built into build_client. It asks the server what operations exist and forwards the calls, which is why an experiment can drive an instrument nobody wrote a client for. describe() is the quick answer to "what can this thing do"; the considered one is the module's documentation at https://docs.plesty.net/plesty-pm100d/, generated from the code so it cannot drift from what the server accepts.
Operations and parameters are different things, and the split matters when you come to write a module:
| Operations | Parameters | |
|---|---|---|
| What | Things the instrument does | Settings it holds |
| Called with | pm.measure_power(...) |
pm.write(key, value) / pm.query(key) |
| Example | zero_sensor() |
wavelength |
The same bench, without the window
Everything you did in the console is a command, which is what a bench being scripted or brought up on boot actually uses:
plesty-server declare pm100d-spare plesty-pm100d --version 0.1.0 \
    --arg --mock                       # Edit ▸ Add device…
plesty-server install pm100d-spare     # Install
plesty-server start pm100d-spare       # Start
plesty-server status                   # the device table
plesty-server log pm100d-spare -n 20   # the Log tab
declare writes the same declaration the console's form does, and prints the port it allocated. --version takes a PyPI release; --git with --ref installs from a repository.
Stop it
Stop in the window, or:
plesty-server stop pm100d
One server is the whole platform in miniature: a module found on the hub, installed on a bench, running as a process on a port, answering a client, and keeping a log.
Next: three of them at once — where a bench stops being one device, and the three of them have to agree about what is on the optical table.