
The records of a run are what the instruments returned. A result is something else — a splitting in µeV with its uncertainty. Turning one into the other is an analyzer's job; writing down what it found is a report's.
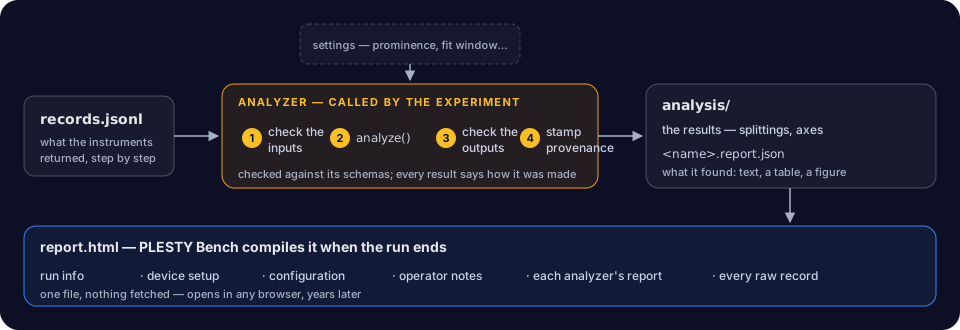
The experiment calls the analyzer
An analyzer is not a stage the data passes through on its way to the experiment. The experiment calls it, as one of its own steps — in the pol-pl demo, the last one. So the analysis is journaled and resumable like any step, and it can be run again later on a copied run, with other settings, without touching an instrument.
An analyzer only computes: it never talks to a device, and its settings are given when it is created, never hidden in its code. Calling it checks its inputs and outputs against its schemas and stamps every result with its provenance — class, package version and settings — so a number found in a run folder years later still says how it was made.
What an analyzer reports
A result is a set of arrays; what a reader wants is a sentence, a table and a
figure. So an analyzer also writes a report beside its results,
<name>.report.json:
- a conclusion — two of four lines split, by 11.52 ± 0.13 and 11.42 ± 0.21 µeV;
- a table laid out for a paper, every value shown to the digits its uncertainty allows;
- a figure, drawn with the same pieces as a live view.
A saved report needs nothing installed to be read: it renders itself to HTML or LaTeX, so a report from a module this PC has never seen still shows.
The report of a whole run
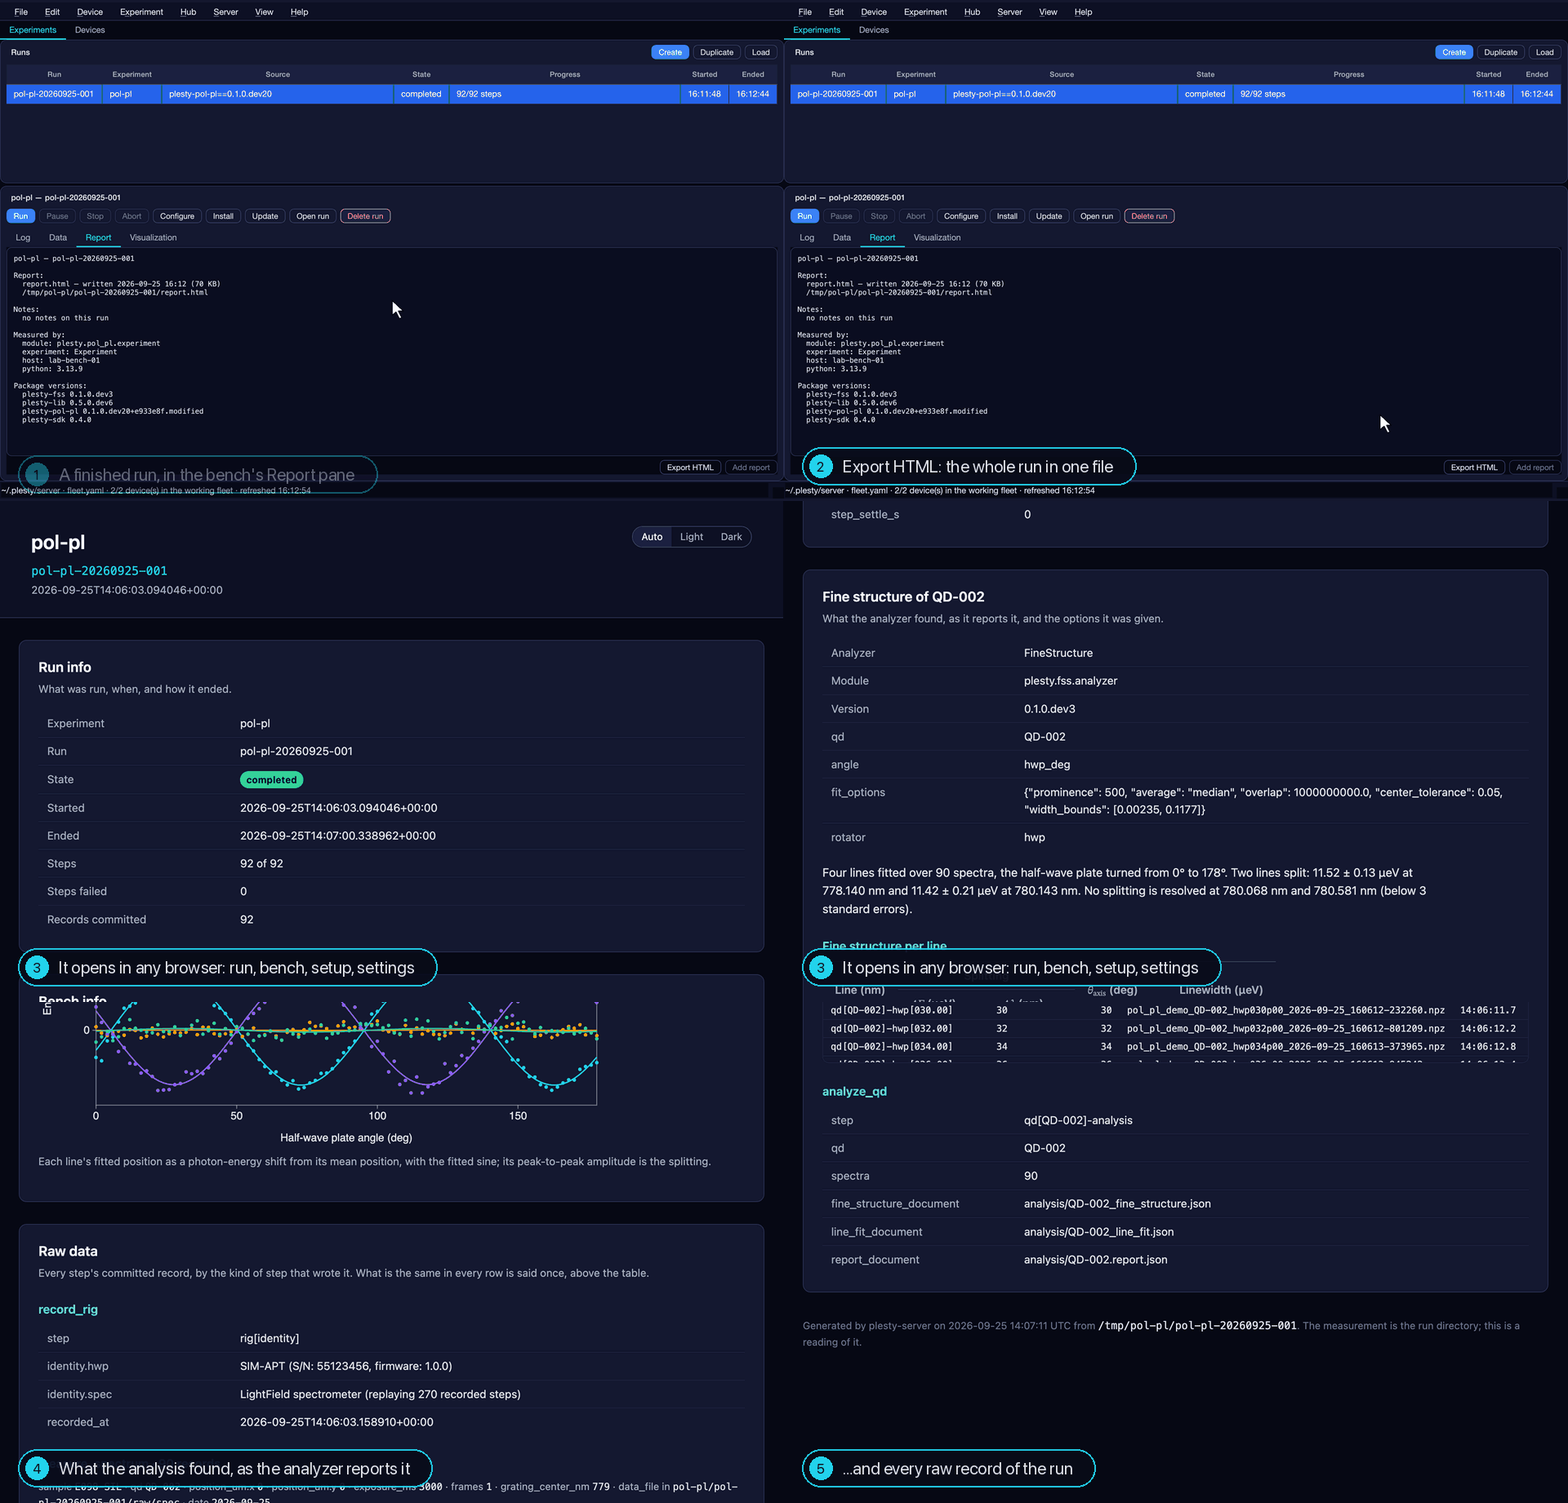
When a run ends — completed, stopped or aborted — PLESTY Bench compiles its
whole folder into report.html: the run, where each instrument ran, the
settings, the operator's notes, each analyzer's report and every record. One
file, with nothing to fetch, that opens in any browser. Export HTML saves a
copy anywhere.
Read next
- Interfaces — where runs are started, watched and read back.